


In any market—whether you’re watching the VN-Index, USD/VND forex charts, or global equities—TradingView tools can give thoughtful investors a crucial edge over random speculators: the ability to recognize a trend.
It’s one thing to spot a spike or a drop in price. But to understand whether the movement is part of a meaningful trend, a temporary reaction, or just noise, you need more than just headlines. You need structure, clarity, and context. That’s where TradingView tools come in—not as a shortcut to predict the future, but as a framework to interpret it more clearly.
Why Trend Analysis Matters—Especially in Vietnam
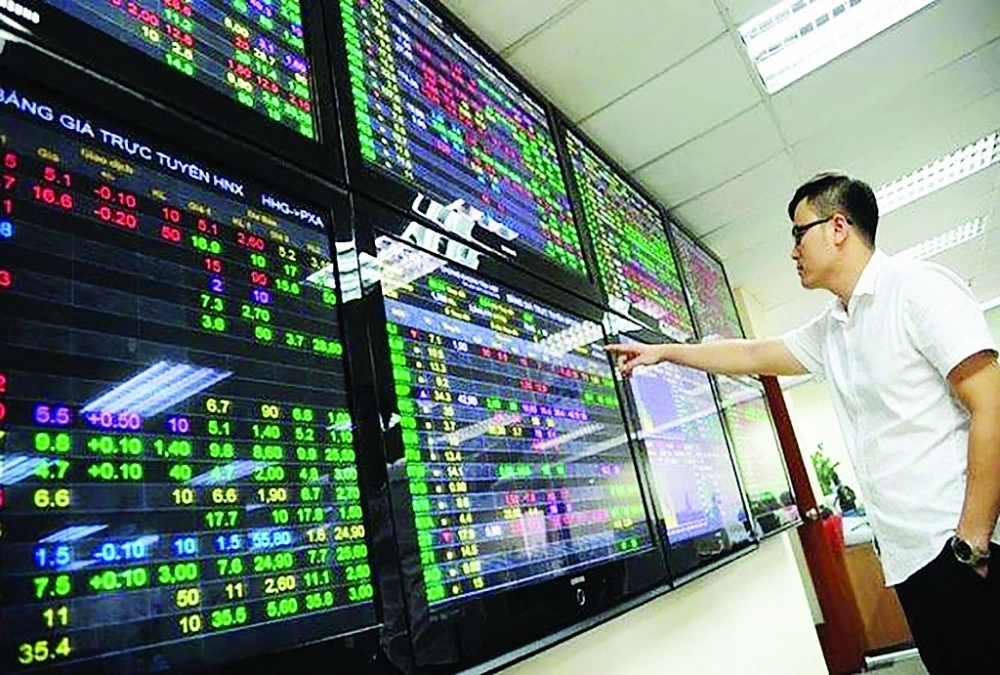
Credit from Vietnam Chamber of Commerce and Industry (VCCI)
Vietnam’s stock market has matured significantly over the past decade. The VN-Index, once seen as volatile and opaque, is increasingly followed by both domestic and foreign investors. Meanwhile, the Vietnamese đồng remains a point of interest in forex markets, especially as the country continues to integrate deeper into global trade flows.
In this environment, trend analysis isn’t a luxury; it’s essential. Investors want to know: are we in a rising cycle driven by macro optimism? Is a sector rotation underway in the VN30? Is the USD/VND pair stabilizing or preparing for a breakout? Without a trend framework, these questions are guesswork.
Using TradingView tools to Spot Trend Direction
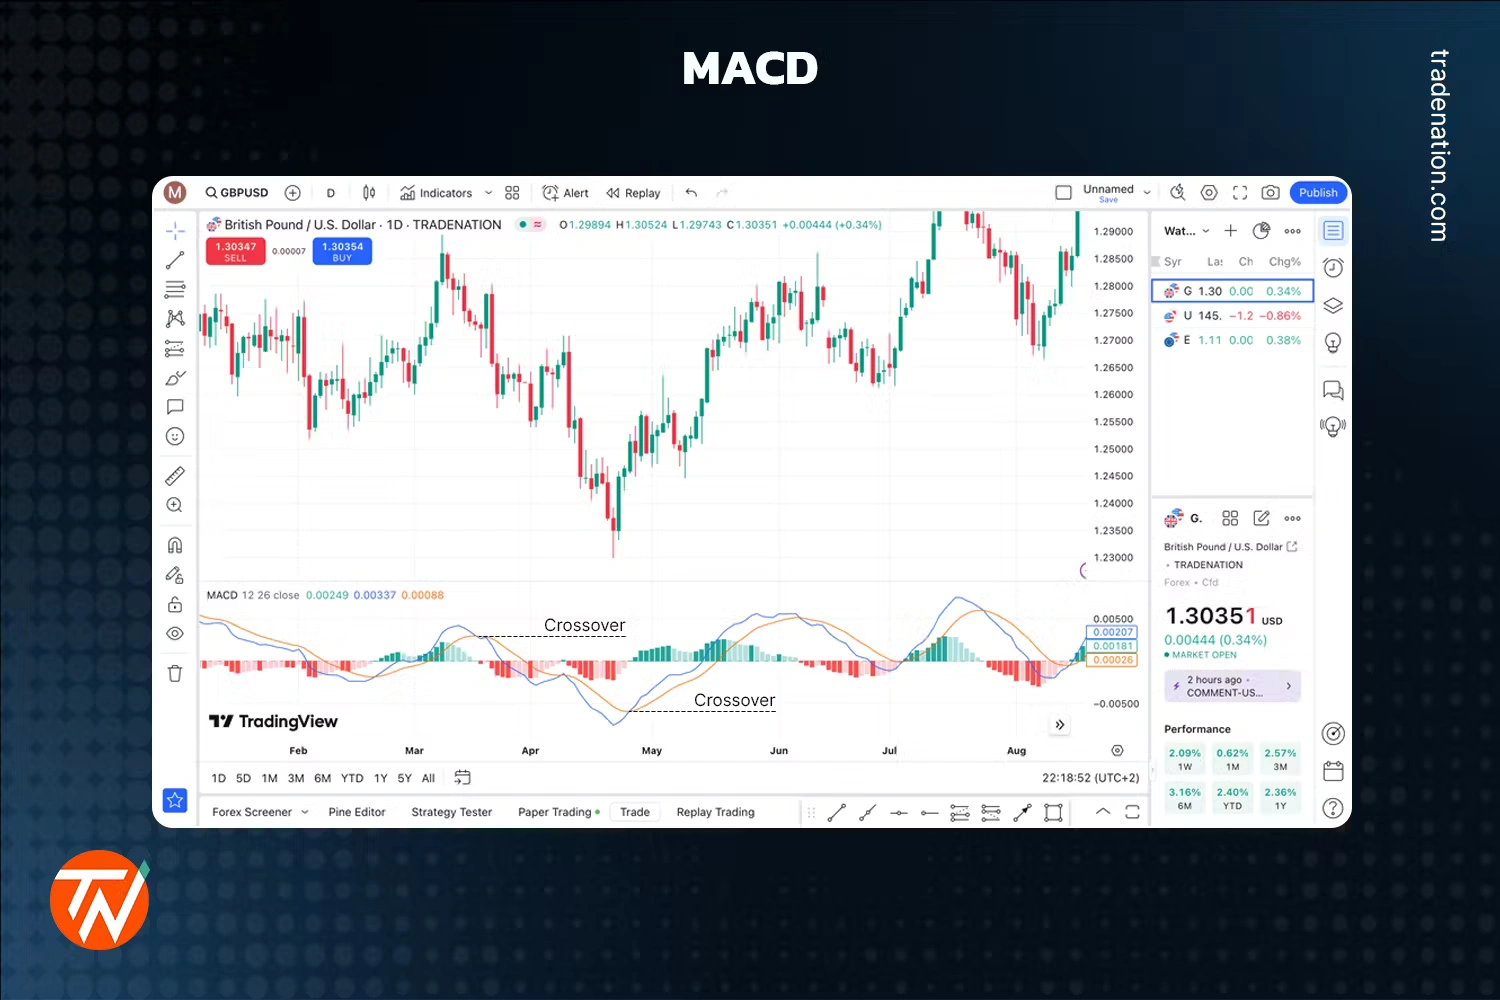
Credit from Trade Nation
Let’s begin with something simple but foundational: the Moving Average. On TradingView, you can easily overlay a 50-day or 200-day moving average on the VN-Index chart. This smooth line instantly helps you answer a basic question: are we trending upward, downward, or going sideways?
Take a recent example. During early 2024, the VN-Index climbed steadily from around 1,000 points to over 1,300. While news headlines alternated between optimism and caution, the moving average told a more consistent story—a long-term upward trend supported by capital inflows and earnings recovery.
In the same period, the USD/VND chart revealed a different pattern. After a brief spike, the price hovered in a narrowing range. By drawing trendlines using TradingView’s drawing tools, you could visually spot a “consolidation” phase. Trend analysis isn’t about flashy predictions—it’s about understanding what phase the market is in.
Trendlines, Channels, and the Human Eye
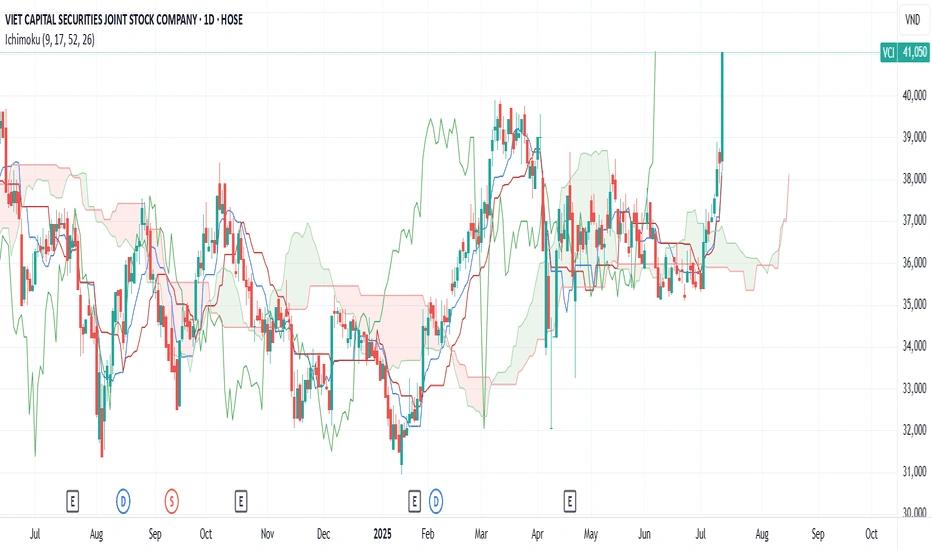
One of the simplest and most human tools on TradingView is the basic trendline. Unlike an algorithm, your eye can recognize a rising series of higher lows or a falling pattern of lower highs. Drawing these on the chart helps give shape to what your intuition is already noticing.
For VN30 stocks like FPT or MWG, this becomes especially helpful. Instead of reacting to every short-term dip, a beginner can draw a rising channel and observe how the price respects it over weeks or months. When a price breaks below that structure, it’s often an early signal that something has changed.
Channels, rays, and even horizontal support lines—when used consistently—train the beginner’s eye to stop focusing on the latest candle and start seeing movement in relation to history.
Indicators that Support Trend Confirmation in TradingView tools
TradingView offers many built-in indicators to confirm (or challenge) your trend hypothesis. The RSI (Relative Strength Index) tells you if the current momentum is strong or weakening. When a stock makes a new high, but RSI starts falling, it could be a sign of hidden weakness.
The MACD (Moving Average Convergence Divergence) adds another layer, showing where the short-term trend is pulling away from—or returning to—the long-term average.
Forex traders analyzing USD/VND often pair Moving Averages with RSI to understand if a price surge is sustainable or simply a temporary overreaction.
Again, the goal isn’t prediction—it’s recognition. With tools like these, even beginners can form more grounded opinions about where a price might go next.
From Trend to Strategy: What Beginners Can Actually Do
The beautiful thing about TradingView is that it doesn’t just show you data—it helps you build a habit of observation. By setting alerts, saving layouts, or using market replay, you’re not just watching the market passively. You’re actively training your analytical muscle.
Let’s say you notice a consistent uptrend on VNM (Vinamilk) using a 100-day moving average. By saving this setup on your chart and setting an alert if the price crosses below, you create a simple strategy: ride the trend, exit when the pattern breaks.
For beginners in Vietnam, this means moving beyond tip-based trading or chat-room opinions. It means forming your own view—based on chart structure, not sentiment alone.
Avoiding False Trends: When Not to Trust What You See
Of course, not every pattern is trustworthy. Beginners often mistake short-term bounces for long-term reversals. That’s why multi-timeframe analysis is crucial.
TradingView allows you to switch from a daily chart to a weekly or even monthly view. A stock that looks bullish on a 1-hour chart may still be inside a broader downtrend on a weekly chart. Context matters.
Also, keep in mind that indicators can lag. Just because MACD turns bullish doesn’t mean the trend will continue. It’s best used in conjunction with volume analysis and price action.
The rule of thumb: trust trends that align across multiple timeframes, and don’t bet too heavily on short-lived moves.
The Role of Community Ideas and Shared Charts
One often overlooked advantage of TradingView is its social layer. By browsing ideas posted by Vietnamese traders—or publishing your own—you can see how others interpret trends using the same charts. It’s not about copying strategies but comparing perspectives.
Over time, you’ll begin to notice patterns in how experienced users structure their charts, what indicators they pair, and how they describe trend phases. This peer learning process is especially valuable for beginners who may still lack confidence in their own analysis.
TradingView tools Conclusion: Trend Awareness Is the First Step Toward Trading Maturity
Credit from TradingView
Using TradingView tools for trend analysis doesn’t mean trying to predict the market—it means building a habit of asking the right questions. Are we in an uptrend or downtrend? Are support levels holding? What is the broader structure telling us?
Whether you’re watching the VN-Index, analyzing USD/VND forex charts, or following a few select stocks, the ability to identify trends—visually, logically, and with the help of TradingView’s toolkit—is the starting point of all good analysis.
And in a fast-growing market like Vietnam, that clarity may be your most valuable trading asset.