


MACD RSI for Forex Indonesia: In Indonesia’s highly dynamic forex scene, traders deal with layered complexity — a blend of local political news, Bank Indonesia moves, and international market pressure. For this reason, relying on price action alone can feel like chasing shadows. Indicators like MACD RSI for Forex Indonesia help to provide structure, helping traders interpret price behavior with greater clarity. These tools don’t just show where the market has been — they give hints about what could come next. With the right understanding, they allow Indonesian traders to make more confident decisions, cut down on emotional reactions, and stay in sync with momentum, trend strength, and reversal signals.
Understand How MACD Detects Trend Momentum
MACD, or Moving Average Convergence Divergence, is a momentum-based indicator that visualizes the relationship between two moving averages — typically the 12-period and 26-period EMAs. The signal line (9-period EMA) is used to confirm or reject the signals. What makes MACD so effective in Indonesia’s forex market is its clarity during key macroeconomic phases. When the MACD line crosses above the signal line, it suggests increasing bullish momentum. Conversely, a downward cross signals weakening strength. Local traders often look for these shifts ahead of major releases like the BI 7-Day Repo Rate decision, using MACD to stay a step ahead of possible trend reversals.
Use RSI to Track Market Strength and Spot Overreactions
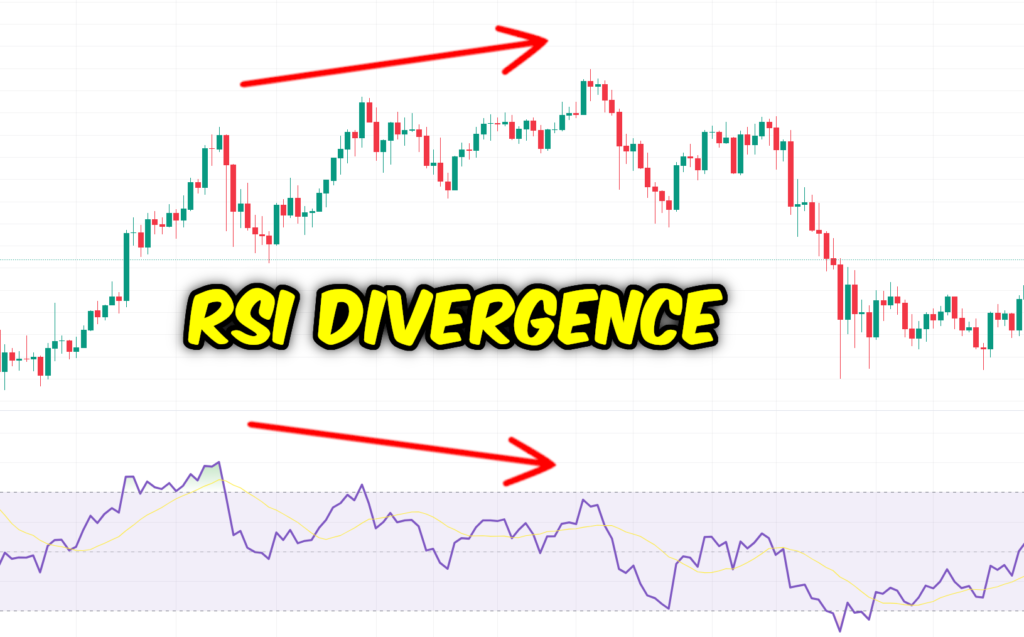
Source: Mind Math Money
The Relative Strength Index (RSI) is designed to measure how intensely a currency pair has moved over a given period. It operates between a range of 0–100 and is often used to identify overbought and oversold zones. In the context of Indonesian forex, RSI is commonly used to evaluate whether strong moves — such as those triggered by rupiah-related economic shocks — are sustainable or exaggerated. A reading above 70 might signal that buying pressure is overextended, while a drop below 30 often points to a possible rebound. Many traders use RSI to verify what they see with MACD, especially when assessing high-risk setups.
Combine MACD and RSI to Strengthen Trade Signals
The real value comes when MACD and RSI are used together. MACD shows directional bias and momentum, while RSI reveals whether that movement is sustainable or already exhausted. For Indonesian traders, using both means they’re less likely to be fooled by noise. For example, if MACD suggests a bullish trend but RSI is already overbought, traders may wait for a retracement. On the other hand, when both MACD crosses upward and RSI is rising but still below 70, it may signal that momentum is building. This combination helps form a well-rounded, data-backed perspective, ideal for planning trades in the often reactive Asian sessions.
Layer Bollinger Bands to Visualize Volatility and Entry Zones
Bollinger Bands are volatility indicators built around a simple moving average, with two bands above and below it based on standard deviation. When the bands widen, volatility is increasing; when they narrow, the market is quieter. Indonesian forex traders often pair Bollinger Bands with MACD and RSI to better time their entries. For example, a price touching the upper band along with a flattening RSI and MACD divergence can signal weakening momentum. Alternatively, a price near the lower band combined with a bullish MACD crossover and RSI climbing from oversold can signal a potential long opportunity. These setups help with timing in volatile markets.
Apply Moving Averages to See the Broader Price Context
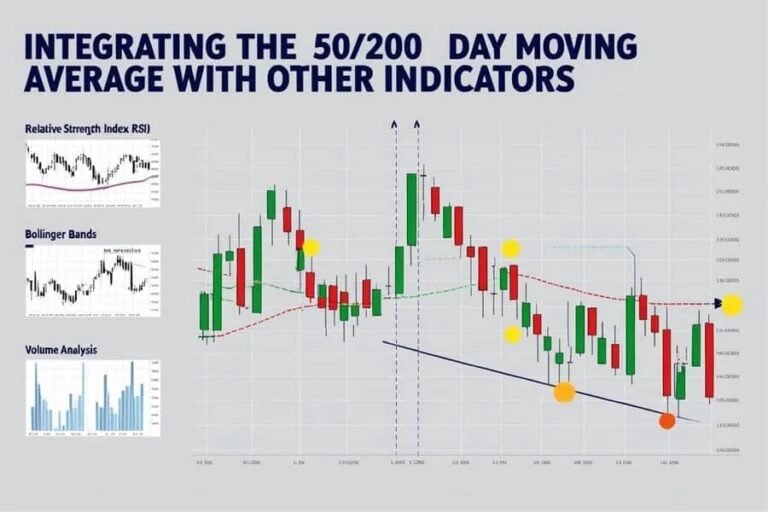
Source: OPOfinance
Moving averages (MA) are foundational for identifying the overall market direction. Traders in Indonesia often use the 20-day, 50-day, or 200-day moving averages as reference levels to guide their strategies. For instance, if the 20-day EMA crosses above the 50-day EMA, and RSI confirms rising strength while MACD shows a bullish signal, the trader may feel more confident entering a long position. Moving averages also help clarify trend phases — when prices pull back to the average, traders often reassess. Used alongside MACD and RSI, moving averages become a filter to avoid trades that go against the prevailing market flow.
MACD RSI for Forex Indonesia: Use the Stochastic Oscillator for Precision Timing
The stochastic oscillator is a momentum indicator that helps traders identify overbought or oversold conditions faster than RSI. It does this by comparing a closing price to its recent range and produces two lines — %K and %D. In Indonesia’s fast-moving forex sessions, this tool is often used for sharper entry timing after confirmation from MACD and RSI. For instance, if MACD is turning bullish and RSI is moving through 50, a crossover in the stochastic below 20 may indicate a strong entry point. By combining these three indicators, traders gain clearer setups — especially valuable when reacting to short-term news spikes or price surges.
MACD RSI for Forex Indonesia: Don’t Let Indicators Lead You Blindly
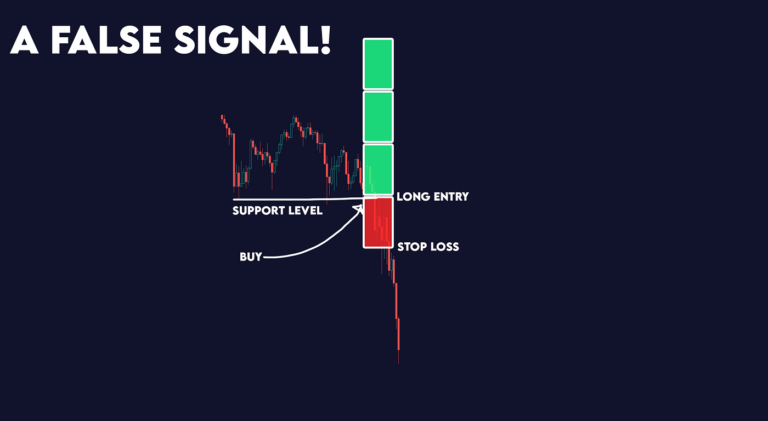
Source: Medium
Technical indicators are powerful, but they require context. One risk for Indonesian traders is assuming indicators tell the whole story. For example, a MACD bullish crossover might not hold up if it happens during low liquidity hours or without fundamental support. Another common issue is analysis overload — when too many indicators contradict each other and cloud decision-making. Indicators should confirm, not confuse. The most effective traders use MACD RSI for Forex Indonesia as part of a broader strategy that includes chart patterns, key levels, economic events, and solid risk management. Avoid making decisions based solely on one data point.
MACD RSI for Forex Indonesia: Why MACD and RSI Still Matter in 2025
As algorithmic trading and AI-powered tools evolve, MACD RSI for Forex Indonesia remain essential due to their simplicity, transparency, and adaptability. These indicators don’t promise profits, but they provide a consistent lens through which Indonesian traders can interpret price behavior. In 2025’s market landscape — where volatility can surge within minutes due to global sentiment shifts — having a repeatable method matters more than ever. MACD and RSI help you avoid emotional trades, stay disciplined, and read market momentum more clearly. Used with care and in combination with other reliable tools, they’ll continue to be part of the serious trader’s daily workflow.