


Top Candlestick Charts Patterns Every Position Holder Should Know
If you’re serious about position holding, understanding candlestick charts is essential. These patterns help traders interpret market signals and time their entries and exits with greater precision. Below is a curated list of key candlestick patterns that can enhance your market strategy.
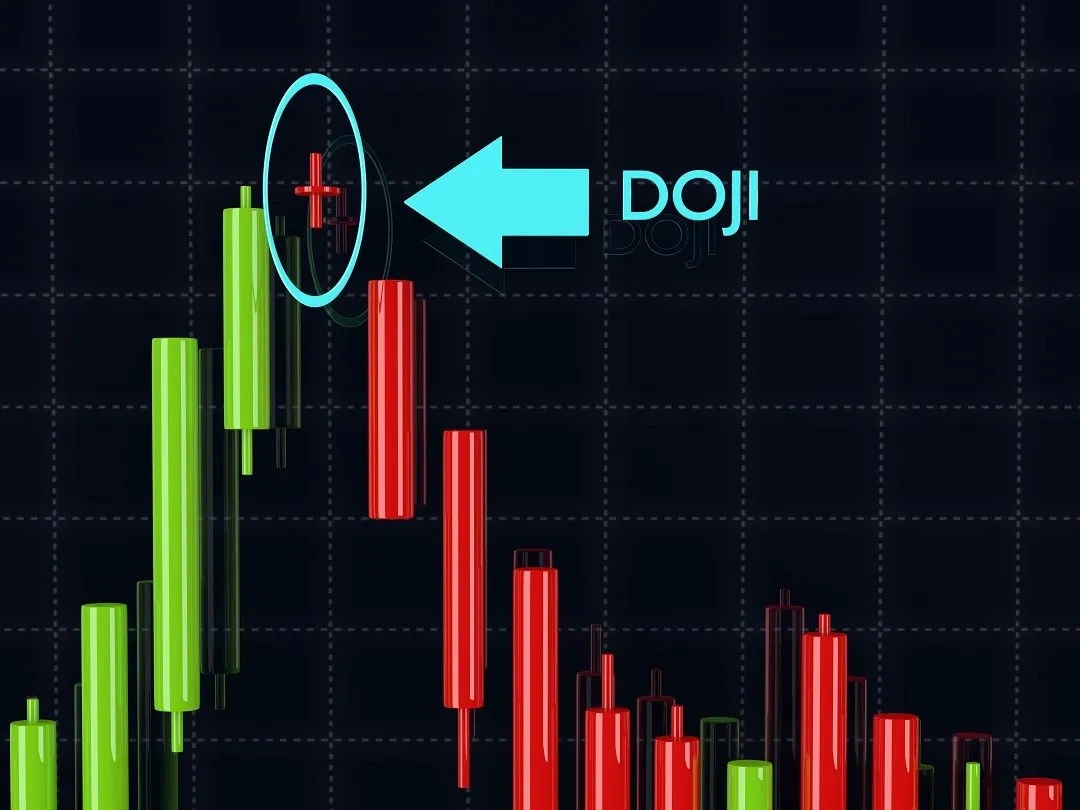
1. The Doji: A Signal of Market Indecision in Candlestick Charts
A doji appears when the opening and closing prices are nearly identical, indicating indecision in the market. While not a standalone buy/sell signal, it’s useful when seen alongside other indicators. For position holders, it can signal a potential pause or reversal, especially near support or resistance zones.
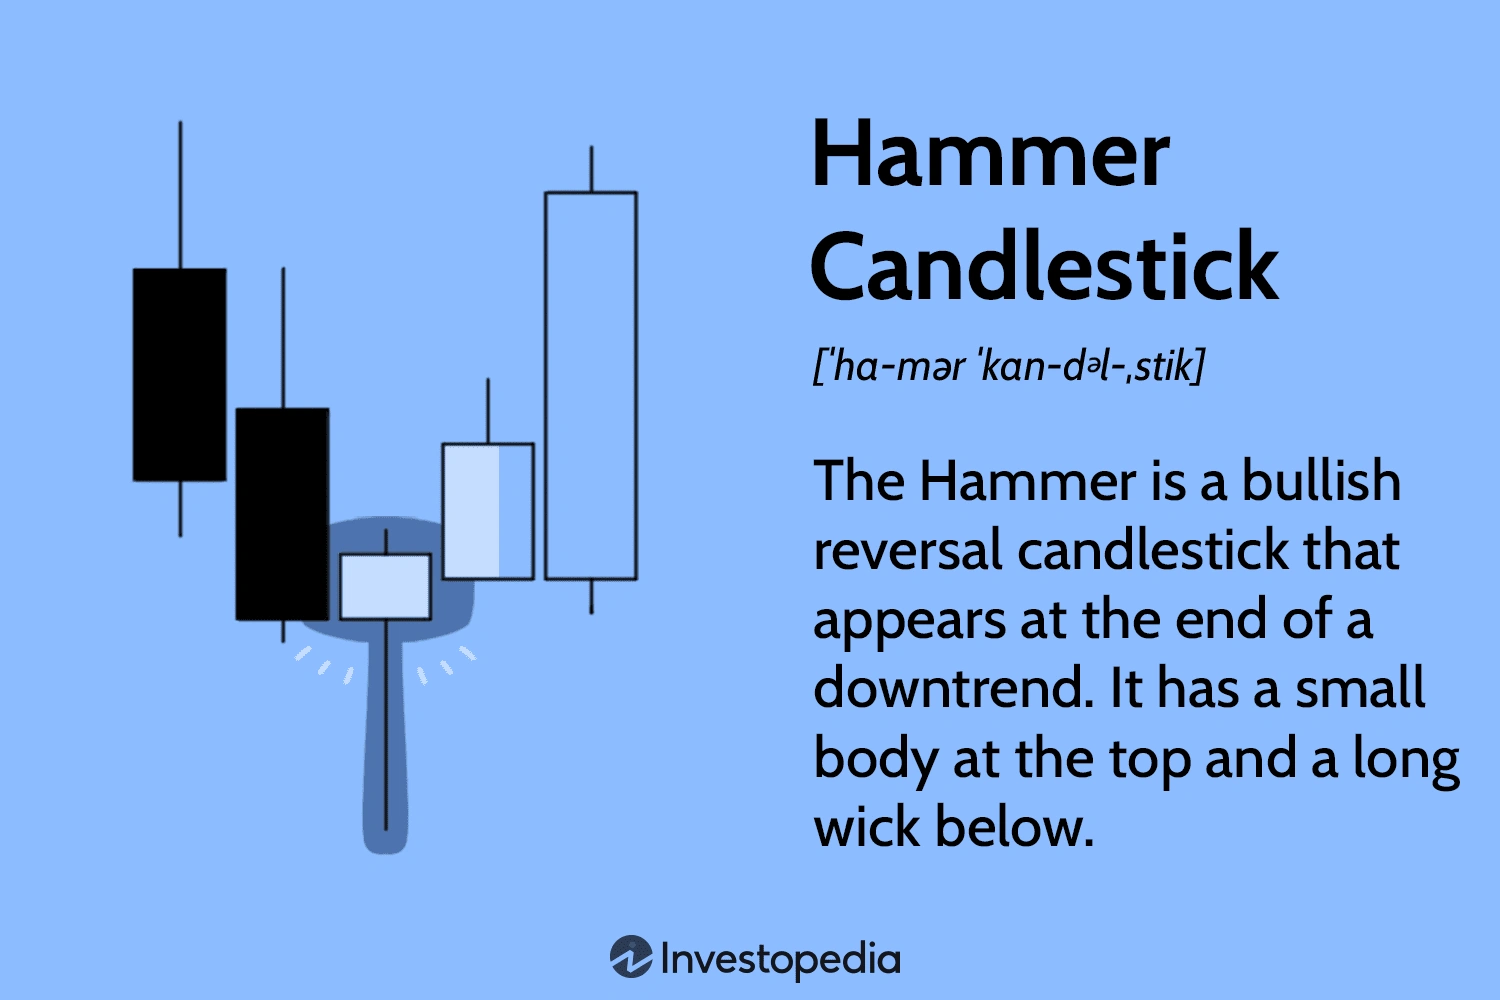
2. Hammer and Hanging Man: Watch the Tails
These single-candle patterns are easy to spot. The hammer signals potential bullish reversal, found after a downtrend. The hanging man, on the other hand, may indicate a bearish reversal at the top of an uptrend. For effective position holding, identifying these early helps reduce risk exposure.
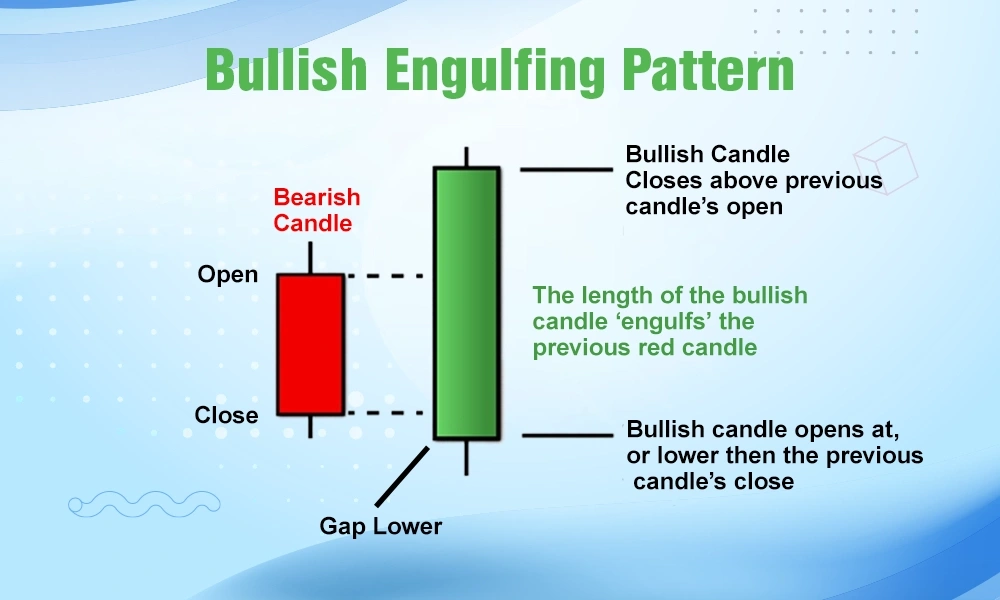
3. Engulfing Patterns: Power Behind the Candles
Engulfing patterns are formed by two candles. A bullish engulfing pattern shows a green candle completely overtaking the prior red candle, often signaling strong buyer interest. This can suggest a solid entry for long-term holders. Conversely, bearish engulfing patterns alert traders to exit or tighten stops.
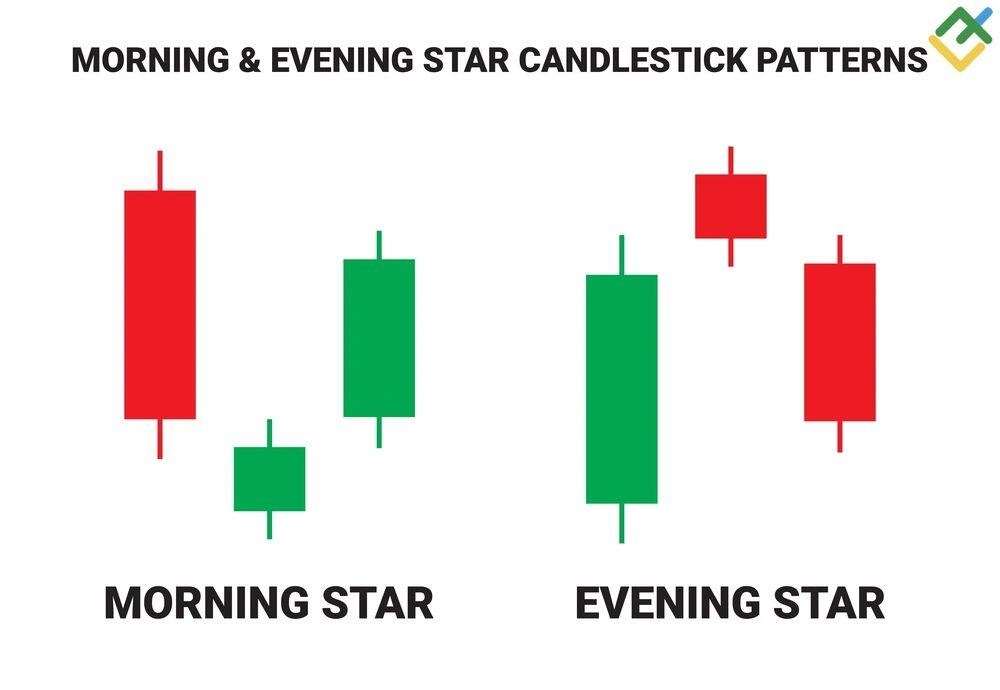
4. Morning and Evening Stars: The Three-Candle Turnaround
These three-candle formations mark major turning points. Morning star indicates bullish reversal, while evening star signals bearish movement. For those focusing on position holding, spotting these early provides time to realign your positions with shifting trends.
5. Spinning Tops: A Volatility Warning
Spinning tops have small bodies and long wicks, reflecting market uncertainty. They often signal a slowdown in momentum, which may precede a trend reversal. In position holding strategies, they’re useful for tightening stop-losses or avoiding hasty decisions during periods of volatility.
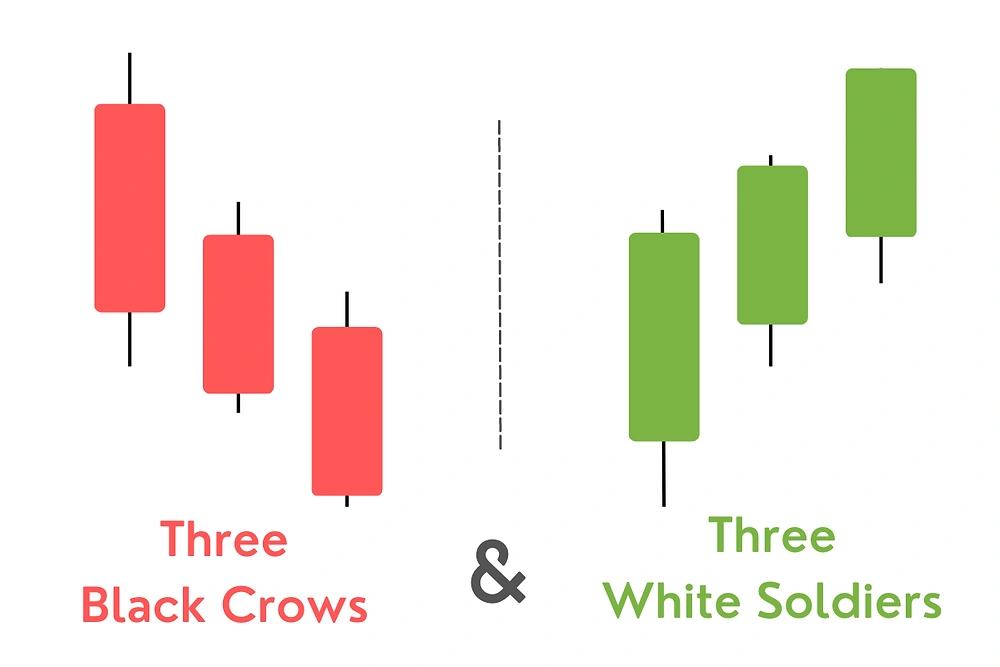
6. Three White Soldiers and Three Black Crows: Strong Trend Indicators
These multi-bar patterns are strong trend signals. Three white soldiers suggest sustained bullish momentum, great for confirming long-term buys. On the flip side, three black crows often signal bearish dominance. Position holders use these to stay in or step out of trades with confidence.
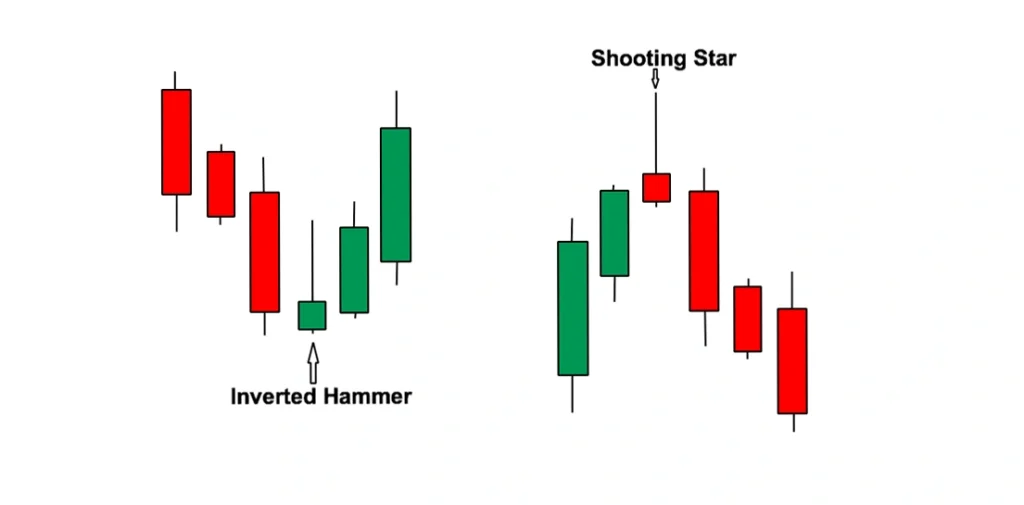
7. Inverted Hammer and Shooting Star: Don’t Miss the Tops and Bottoms
Similar in structure but opposite in implication, the inverted hammer is a bullish signal after a decline, while the shooting star signals a bearish trend after a rise. Recognizing these patterns helps traders position themselves ahead of a possible trend reversal—key for sound position holding.
Final Takeaway of Candlestick Charts: Use Patterns, But Don’t Ignore the Context
Candlestick patterns offer powerful visual cues, but they’re most effective when combined with volume, trendlines, and other technical indicators. In position holding strategies, context is everything. Be patient, validate patterns, and always consider the broader market picture.